

Solving Linear and Quadratic Equations and Absolute Value Equations
| Slide 31 | Solving Absolute Value Equations
|
||||||||||||||||||||||||||||||||||||||||
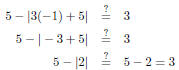
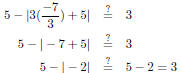
| Slide 32 | Solving Absolute Value Equations Highly recommended: Check your solutions by plugging them back into the original equation:
Yes!
Yes! |
||||||||||||||||||||||||||||||||||||||||
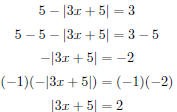
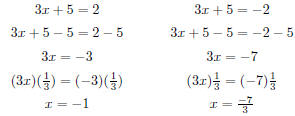
| Slide 33 | Solving Absolute Value Equations Note that simplifying absolute values should come early in the order of operations, similar to brackets and parentheses. |3x + 5| = 2 is not the same as |3x| + 5 = 2 |
||||||||||||||||||||||||||||||||||||||||
| Slide 34 | Example: Using Absolute Values in Statistics You are studying the relationship between head injury and helmet use among people involved in bicycle accidents (Pagano and Gauvreau, page 311). You have information for 793 people involved in accidents. Of those, 147 people were wearing helmets and 235 people experienced a head injury. You can make a table that illustrates what you know, and add what you would expect to see if there were no association between helmet use and head injury:
|
||||||||||||||||||||||||||||||||||||||||
| Slide 35 | Example: Using Absolute Values in Statistics Here is the table of expected values we just created:
When you add the information you have about helmet
use among
|
||||||||||||||||||||||||||||||||||||||||
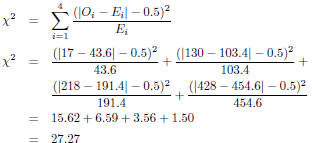
| Slide 36 | Example: Using Absolute Values in Statistics We can use a “test statistic” to see whether the difference between observed and expected values is big enough to signify that wearing helmets is associated with fewer head injuries. Here’s what the test statistic looks like:
|
||||||||||||||||||||||||||||||||||||||||
| Slide 37 | Example: Using Absolute Values in Statistics
What does this mean? Is there an association
between helmet use |
||||||||||||||||||||||||||||||||||||||||
| Slide 38 | Inequalities An inequality is like an equation, but it says that two expressions are not equal. a ≠b a is not equal to b a < b a is less than b
a > b a is greater than b
a ≥b a is greater than or equal to b |
||||||||||||||||||||||||||||||||||||||||
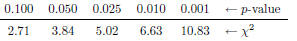
| Slide 39 | Example: Using Inequalities The value of the test statistic, χ2, that we obtained in the last example was 27.27. We can look this up in a table and see how “statistically significant” this is. The smaller the p-value, the more statistically significant.
As we can see from the table, the p-value gets
smaller as the χ2 |
||||||||||||||||||||||||||||||||||||||||
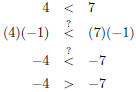
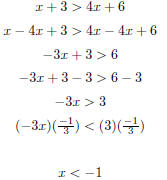
| Slide 40 | Solving Linear Inequalities As with equalities, we can use the additive and multiplicative properties of inequality. One wrinkle: If you multiply both sides of an inequality by a negative number, the direction of the inequality changes. So multiplying or dividing both sides of an equation by a negative number means you should reverse the inequality. Example:
|
||||||||||||||||||||||||||||||||||||||||
| Slide 41 | Solving Linear Inequalities: Example
Check: Does x = −2 work? Does x = −3 work? |
||||||||||||||||||||||||||||||||||||||||

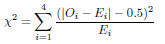
 means “add the
first through the 4th” of what comes next
means “add the
first through the 4th” of what comes next is the observed value for position
i, where i is either 1, 2, 3, or 4
is the observed value for position
i, where i is either 1, 2, 3, or 4 is the expected value in the
corresponding position
is the expected value in the
corresponding position