

Graphing Linear Equations
A linear equation is an equation in two variables, each raised to the 1st power
Ex:  is linear,
 is linear,
  is not linear, nor is
  .
.
The solution of a linear equation is an ordered pair that makes the equation true.
Ex. 1
Is the point (5, 2) a solution of  ? (In other
words, does the line formed by
? (In other
words, does the line formed by
 pass through the point (5, 2)?)
To find out, substitute 5 (the x-coordinate) for the x and
the 2 (the y-coordinate) for y. Does the
left side equal the right side?
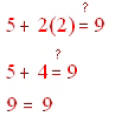
Since the ordered pair made the equation true, the
ordered pair is a solution of the linear
equation.
Is the ordered pair (9, 0) a solution of x + 2y = 9? Yes,
this ordered pair is also a solution. So is
the ordered pair (-7, 8). A linear equation will have an infinite number of
solutions.
There are three methods of graphing linear equations that
we will use: 1) making a table, 2) using
x and y intercepts and 3) using the slope-intercept method.
Ex. 2
Graph by making a table.
1. y = x + 2
First, pick three values for x (you have to choose at
least two x values but you can choose more
than three). They can be any values you want. I usually pick zero, one positive
number and one
negative number:

To find the y-values, substitute each of the x values
into the equation y = x + 2. So the y value
that corresponds to x = 0 is y = 0 + 2, or 2. The y value that corresponds to x
= 1 is 3 and the y
value that corresponds to x = -2 is 0. So I'll complete my table:

Each of these x and y values make an ordered pair. So
the line y = x + 2 passes through the
points (0, 2), (1, 3), and (-2, 0). Now graph each one of those ordered pairs
and connect them
with a line to get this graph:
I would like to note here that you might want to pick a
little more choosy on your x values when
the coefficient of your variable x is a fraction. You can choose any value you
want but you can
choose x values that will give you integer y values.
A good rule of thumb to follow is this: when the
coefficient of the x term is a fraction, choose
zero, the denominator and its opposite.
Obviously, substituting a zero for the x gives us
 or y = 0 + 3. When we put in the
3, notice what happens:
 , two-thirds of 3 is 2. So y = 2 + 3 or y =
5. If we had
, two-thirds of 3 is 2. So y = 2 + 3 or y =
5. If we had
used a 1 for x (and you can use any number that you want), you would have gotten
 which would give you
 . While it is fine to graph a
fraction, it also means that you have to approximate. Graphing integers will
give you a more
precise line. So back to the table, when all of the x values have been
substituted, your table
should look like this:

And the graph will look like this:
There are a couple of special case to point out here.
Suppose you wanted to graph the lines y = 4
and x = 4. You might argue that these are not linear equations since there
appears to be only one
variable. But keep in mind that y = 4 can also be written as 0x + y = 4 (also y
= 0x + 4) and x = 4
can be written as x + 0y = 4. So the graphs of these two equations are a bit
different than the
others. If we make a table and choose 3 values for x and substitute those values
in, our table
would look like this:

Now graphing those points would give us a graph
that looked liked this:
Note: The equation y = k (where k is any constant) is a
horizontal line that crosses the y axis at
k. And so it stands to reason that the equation x = k is a vertical line that
crosses the x axis at k.
So x = 4 will look like this:
Now we'll graph using the x and y intercept method. By
definition, the x intercept is the point
where the line crosses the x-axis. This will always be where y = 0 so the x
intercept will be an
ordered pair (x, 0). The y intercept is the point where the line crosses the
y-axis. This will
always be where x = 0 so the y intercept will be an ordered pair (0, y). We'll
use those definitions
to graph the next example.
Ex. 3
Graph using x and y intercepts.
1. 3x + 2y = 6
*The first thing that you may notice is that the form of this linear equation
is different from the previous example. The x and y are on the same side
of the equal sign instead of opposite sides. Any equation in the form
Ax + By = C is called general form. An equation in the form y = mx + b
is called slope-intercept form. We'll get into that one more later. To find
the x intercept, we'll substitute a 0 for the y: 3x + 2(0) = 6. Now we'll
solve for x and get x = 2. So the x intercept is the ordered pair (2, 0). To
find the y intercept we'll substitute a 0 for the x: 3(0) + 2y = 6. Now we'll
solve for y and get y = 3. So the y
intercept is the ordered pair (0, 3).
Now we'll graph those two
ordered pairs and get this graph: